


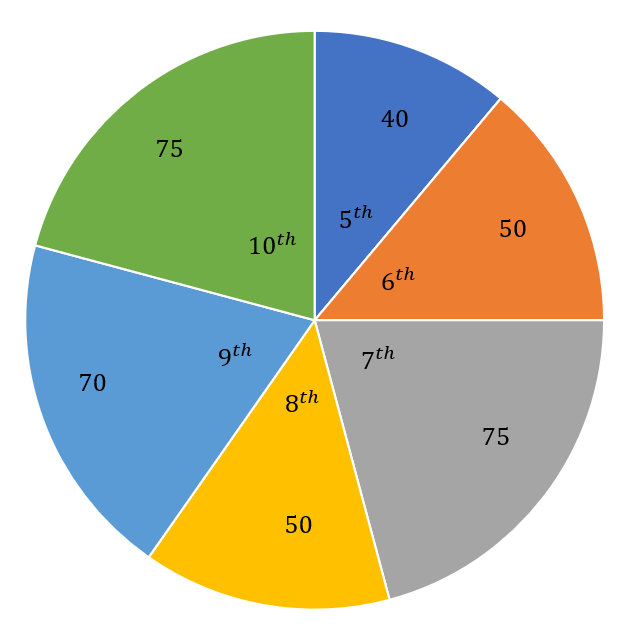
In a tree plantation programme, the number of trees planted by students of different classes given in the following table. Draw a pie diagram showing the information.
Standard \[{5^{th}}\] \[{6^{th}}\] \[{7^{th}}\] \[{8^{th}}\] \[{9^{th}}\] \[{10^{th}}\] Number of trees 40 50 75 50 70 75
| Standard | \[{5^{th}}\] | \[{6^{th}}\] | \[{7^{th}}\] | \[{8^{th}}\] | \[{9^{th}}\] | \[{10^{th}}\] |
| Number of trees | 40 | 50 | 75 | 50 | 70 | 75 |
Answer
545.4k+ views
Hint: In this problem, we need to find the angles corresponding to the number of trees in each class. Next, draw the pie diagram.
Complete step by step solution:
The total number of trees planted by the students is obtained as follows:
\[
\,\,\,\,\,{\text{Total no of trees}} = 40 + 50 + 75 + 50 + 70 + 75 \\
\Rightarrow {\text{Total no of trees}} = 360 \\
\]
The angles corresponding to the number of trees in each class is shown in the below table.
Now, the pie chart is drawn as shown below.
Note: Pie diagram is the circular graphic representation of the data in the form of the slices. Pie chart is used for the representation of the percentage or proportion having each category provided with corresponding slice of pie.
Complete step by step solution:
The total number of trees planted by the students is obtained as follows:
\[
\,\,\,\,\,{\text{Total no of trees}} = 40 + 50 + 75 + 50 + 70 + 75 \\
\Rightarrow {\text{Total no of trees}} = 360 \\
\]
The angles corresponding to the number of trees in each class is shown in the below table.
| Standard | Number of trees | Corresponding central angle |
| \[{5^{th}}\] | 40 | \[\dfrac{{40}}{{360}} \times 360^\circ = 40^\circ\] |
| \[{6^{th}}\] | 50 | \[\dfrac{{50}}{{360}} \times 360^\circ = 50^\circ\] |
| \[{7^{th}}\] | 75 | \[\dfrac{{75}}{{360}} \times 360^\circ = 75^\circ\] |
| \[{8^{th}}\] | 50 | \[\dfrac{{50}}{{360}} \times 360^\circ = 50^\circ\] |
| \[{9^{th}}\] | 70 | \[\dfrac{{70}}{{360}} \times 360^\circ = 70^\circ\] |
| \[{10^{th}}\] | 75 | \[\dfrac{{75}}{{360}} \times 360^\circ = 75^\circ\] |
Now, the pie chart is drawn as shown below.
Note: Pie diagram is the circular graphic representation of the data in the form of the slices. Pie chart is used for the representation of the percentage or proportion having each category provided with corresponding slice of pie.
Recently Updated Pages
Master Class 8 Science: Engaging Questions & Answers for Success
Class 10 Question and Answer - Your Ultimate Solutions Guide
Class 11 Question and Answer - Your Ultimate Solutions Guide
Master Class 11 Accountancy: Engaging Questions & Answers for Success
Master Class 11 Physics: Engaging Questions & Answers for Success
Master Class 11 Business Studies: Engaging Questions & Answers for Success
Trending doubts
What is BLO What is the full form of BLO class 8 social science CBSE
In Indian rupees 1 trillion is equal to how many c class 8 maths CBSE
How many ounces are in 500 mL class 8 maths CBSE
How many ten lakhs are in one crore-class-8-maths-CBSE
When people say No pun intended what does that mea class 8 english CBSE
Give me the opposite gender of Duck class 8 english CBSE